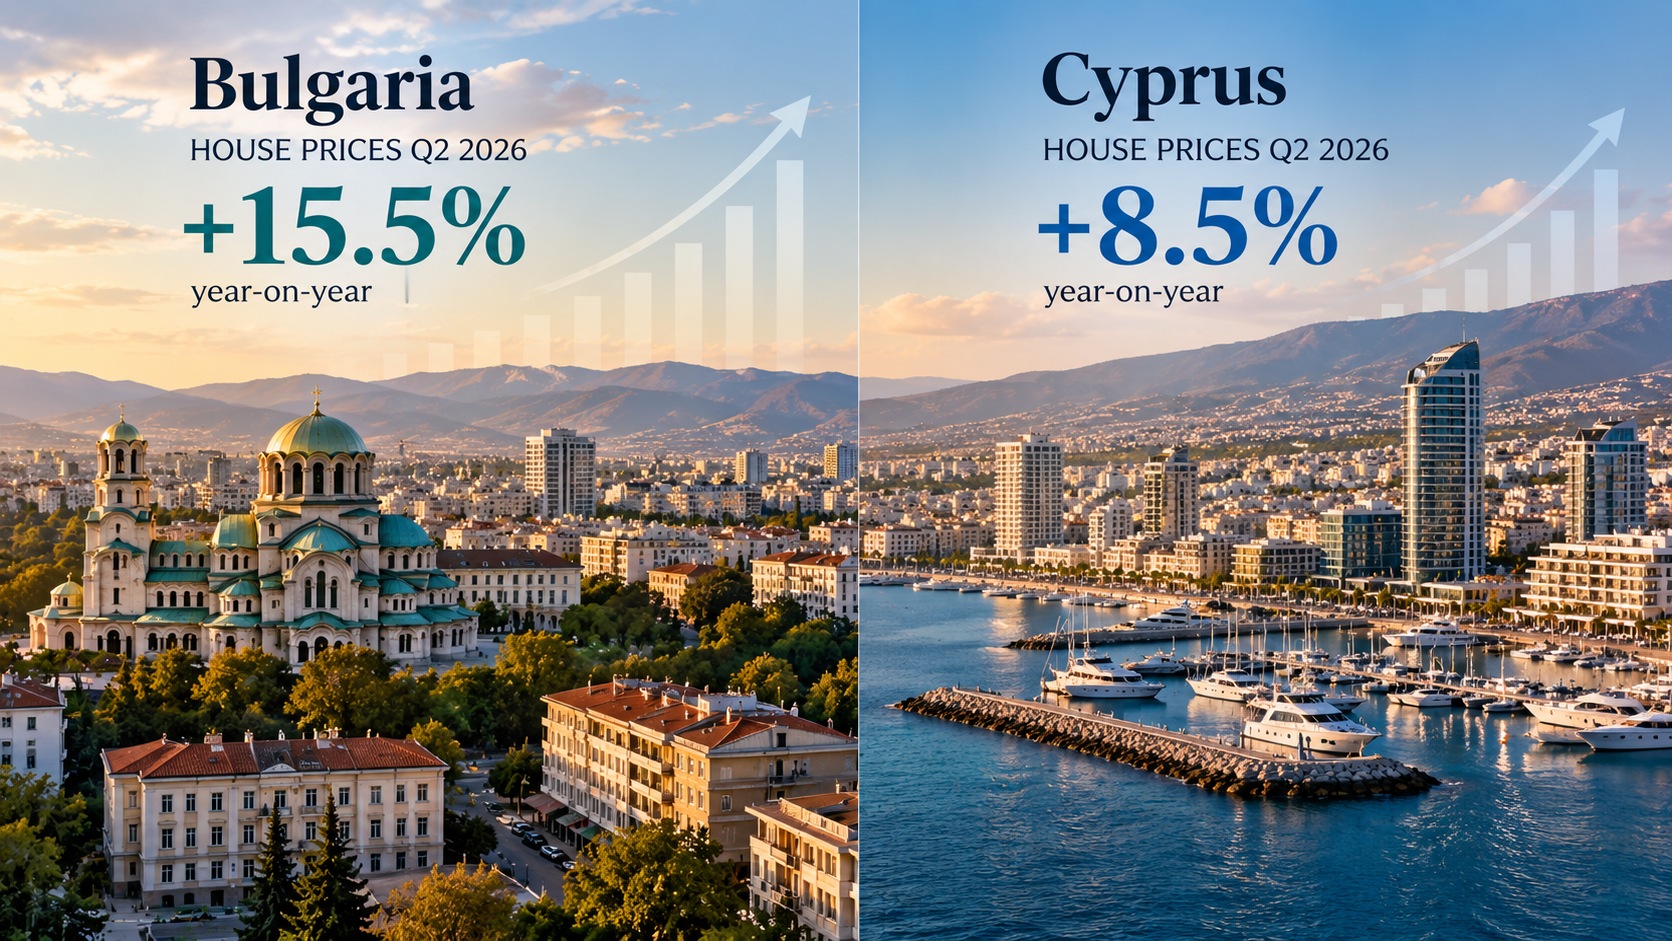
Bulgaria and Cyprus both entered Q2 2026 with faster house-price growth, but the headline percentages describe different market structures. Bulgaria’s National Statistical Institute recorded a 15.5% annual increase and a 4.5% quarterly rise. City performance diverged sharply: Plovdiv rose 5.8% quarter on quarter, Varna 2.8% and Sofia 2.4%, while Burgas fell 1.5%. Cyprus’s Central Bank published its Q2 residential price report on 24 September, with the market continuing to be supported by strong demand, especially from foreign buyers, while supply is gradually expanding. Cyprus also has a much larger future construction pipeline: CYSTAT reports planned dwelling units in January–May up 63.7% year on year to 8,978. The comparison therefore is not simply “15.5% versus 8.5%.” Bulgaria’s immediate question is how sustainable rapid appreciation is across cities moving at different speeds. Cyprus’s is whether foreign-led demand can keep absorbing a rapidly expanding supply pipeline without weakening price momentum.
Sources and limits

National Statistical Institute of Bulgaria — Housing price statistics Q2 2026 ↗
official statistics · 2026-09-23

Central Bank of Cyprus — Residential Property Price Index Q2 2026 ↗
official central bank · 2026-09-24

CYSTAT — Building Permits, May 2026 ↗
official statistics · 2026-09-16
This is research, not investment, tax or legal advice. Definitions and observation dates remain attached to every claim.