What the comparison means
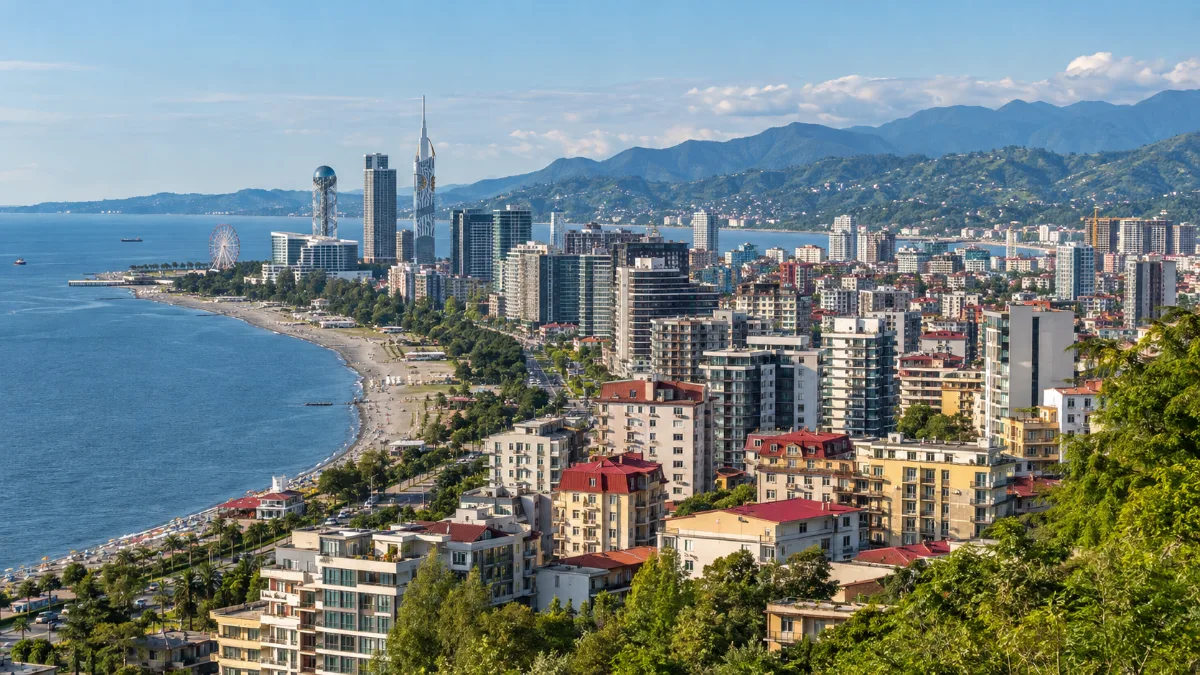
The study uses active projects and district medians, not completed rental returns. HomeRadar estimates modeled occupancy at 42% in Green Cape and 57% in Old Batumi. That difference helps explain why the district with the higher modeled yield is not automatically the easier place to rent year-round or to live. A buyer should compare a specific building, total purchase and running costs, and realistic rental demand for that address.
These are HomeRadar model estimates, not guaranteed returns or asking prices for every apartment. Samples vary by district; Downtown has only four active projects and Chaobi five. The full seven-district table, method and project links are in the original HomeRadar research.
Sources and limits

HomeRadar ↗
Primary research · 2026-10-06
This is research, not investment, tax or legal advice. Definitions and observation dates remain attached to every claim.